Recently, we had the opportunity to benchmark several products using the NVIDIA Hopper architecture, including the NVIDIA H100 Tensor Core GPU and the NVIDIA GH200 Grace Hopper Superchip. While primarily targeted for use in large data centers and for demanding AI applications, the NVIDIA H100 GPU also excels at enhancing scientific HPC applications such as Stone Ridge Technology’s ECHELON reservoir simulator, a high-performance engineering application used in the energy industry to model field development and depletion processes for hydrocarbon assets. Designed from the ground up to execute on GPUs, ECHELON is celebrated for its disruptive level of speed and computational performance.
The first test results of ECHELON with products using the NVIDIA Hopper architecture, presented here, are impressive and extend a decade-long trend of increased capability and application performance with each new hardware generation. In 2016, we published results showing ECHELON’s performance for three different reservoir models over three generations of NVIDIA GPU architectures: Kepler, Maxwell, and Pascal. The data demonstrated that performance increased in proportion to the memory bandwidth of the hardware. We published similar comparisons in 2018 and 2020 for the NVIDIA Volta and NVIDIA Ampere GPU architectures, confirming the continuation of the trend. The significance of these observations lies in the fact that performance improvements were realized as the sole result of generational hardware improvements; no hardware-dependent changes were made to the code. This is reminiscent of the pre-multicore era of CPU computing before 2005. At that time, chip vendors would double clock speeds roughly every two years, and most applications would immediately benefit and execute faster on the new hardware. Once clock frequencies started to approach physical limits, multi-core chips became the prevalent architecture and efficient exploitation of parallelism became the primary path to performance gains. Similarly, ECHELON has demonstrated consistent and proportional generational performance gains since GPUs emerged as general-purpose computing devices in 2008.
With this entry, we extend our collection of performance blogs with a report on NVIDIA H100 GPUs. We also take the opportunity to revise our benchmarking process while preserving the core findings. We have increased the benchmarking suite to include ten different asset models from one of our key partners and compare ECHELON performance on H100 GPUs against the previous two NVIDIA GPU generations, the A100 Tensor Core GPUs and V100 Tensor Core GPUs. The models range from 84,000 cells to 6.7 million cells and include representation from both black oil and compositional models. Before we show details of the comparison results, we take a look at the raw specifications of the hardware under consideration.
A LOOK AT NVIDIA H100 Tensor Core GPUs
Each new generation of GPUs from NVIDIA offers more cores, new features, and much higher performance than the last, and the H100 GPU is certainly no exception. It weighs in with over twice the core count of the A100 GPU, introduces a number of architectural advances improving both ML and HPC application performance, and (optionally) incorporates the latest HBM3 stacked memory for a major upgrade to memory bandwidth.
In recognition of the diverse requirements spanned by the HPC and ML industries, NVIDIA released a number of variants of the H100 GPU. The first one released was a PCIe variant utilizing HBM2e memory, providing 2 TB/s of memory bandwidth. The SXM5 variant came next. With more power available to the chip, it utilizes HBM3 memory, providing 3.3 TB/s of bandwidth and higher compute performance. More recently, another PCIe version, the H100 NVL was released. It was designed to be installed in pairs to handle large language models (LLMs) using even faster HBM3 memory and providing 3.9 TB/s of bandwidth per GPU.
THE NVIDIA GRACE-HOPPER SUPERCHIP
Alongside the H100 GPU, NVIDIA released its first-ever high-performance data center CPU. Appropriately named the NVIDIA Grace CPU Superchip, it’s designed to pair seamlessly with the Hopper architecture. Based on the Armv9 Neoverse V2 architecture, Grace comes with 72 cores and up to 480 GB of LPDDR5X memory, providing up to 512 GB/s of CPU memory bandwidth. Grace is connected to Hopper through a low-latency, high-bandwidth bus called NVIDIA NVLink-C2C, which provides a 900 GB/s cache-coherent connection between the two. Grace Hopper provides two advantages over a typical x86+H100 GPU configuration. First, the performance of the Grace CPU itself is formidable, with four 128-bit vector units per core, extremely high memory bandwidth, and a substantial 189 MB of combined L2 and L3 cache. Second, the coherent link between the Grace and Hopper architectures greatly reduces the communication time between the CPU and GPU, reducing overall runtime. Since Grace is an Arm processor, recompilation is needed to run on the system. For ECHELON, rebuilding was a trivial exercise, and the resulting binary “just worked” on the Grace Hopper Superchip with no further tweaking required. The performance gains were realized with no modifications to the code to take advantage of the CPU, and further optimization for the Grace Hopper system may provide more gains.
THE RAW SPECIFICATIONS
In the six years between the introduction of Volta and the current Hopper architecture, the number of CUDA cores has increased by 3.6x, double-precision FLOPS by 4.4x, and memory bandwidth by 4.3x. Memory bandwidth is of primary importance for high-performance scientific applications like ECHELON, since most of the code is memory-bound, meaning that performance is limited by how fast data can move from main memory to the computing cores. A few sections of the code, such as the compositional equation of state, are compute-bound and therefore limited by the double and single-precision floating point performance. The chart below provides specifications for all the hardware tested.
RESULTS
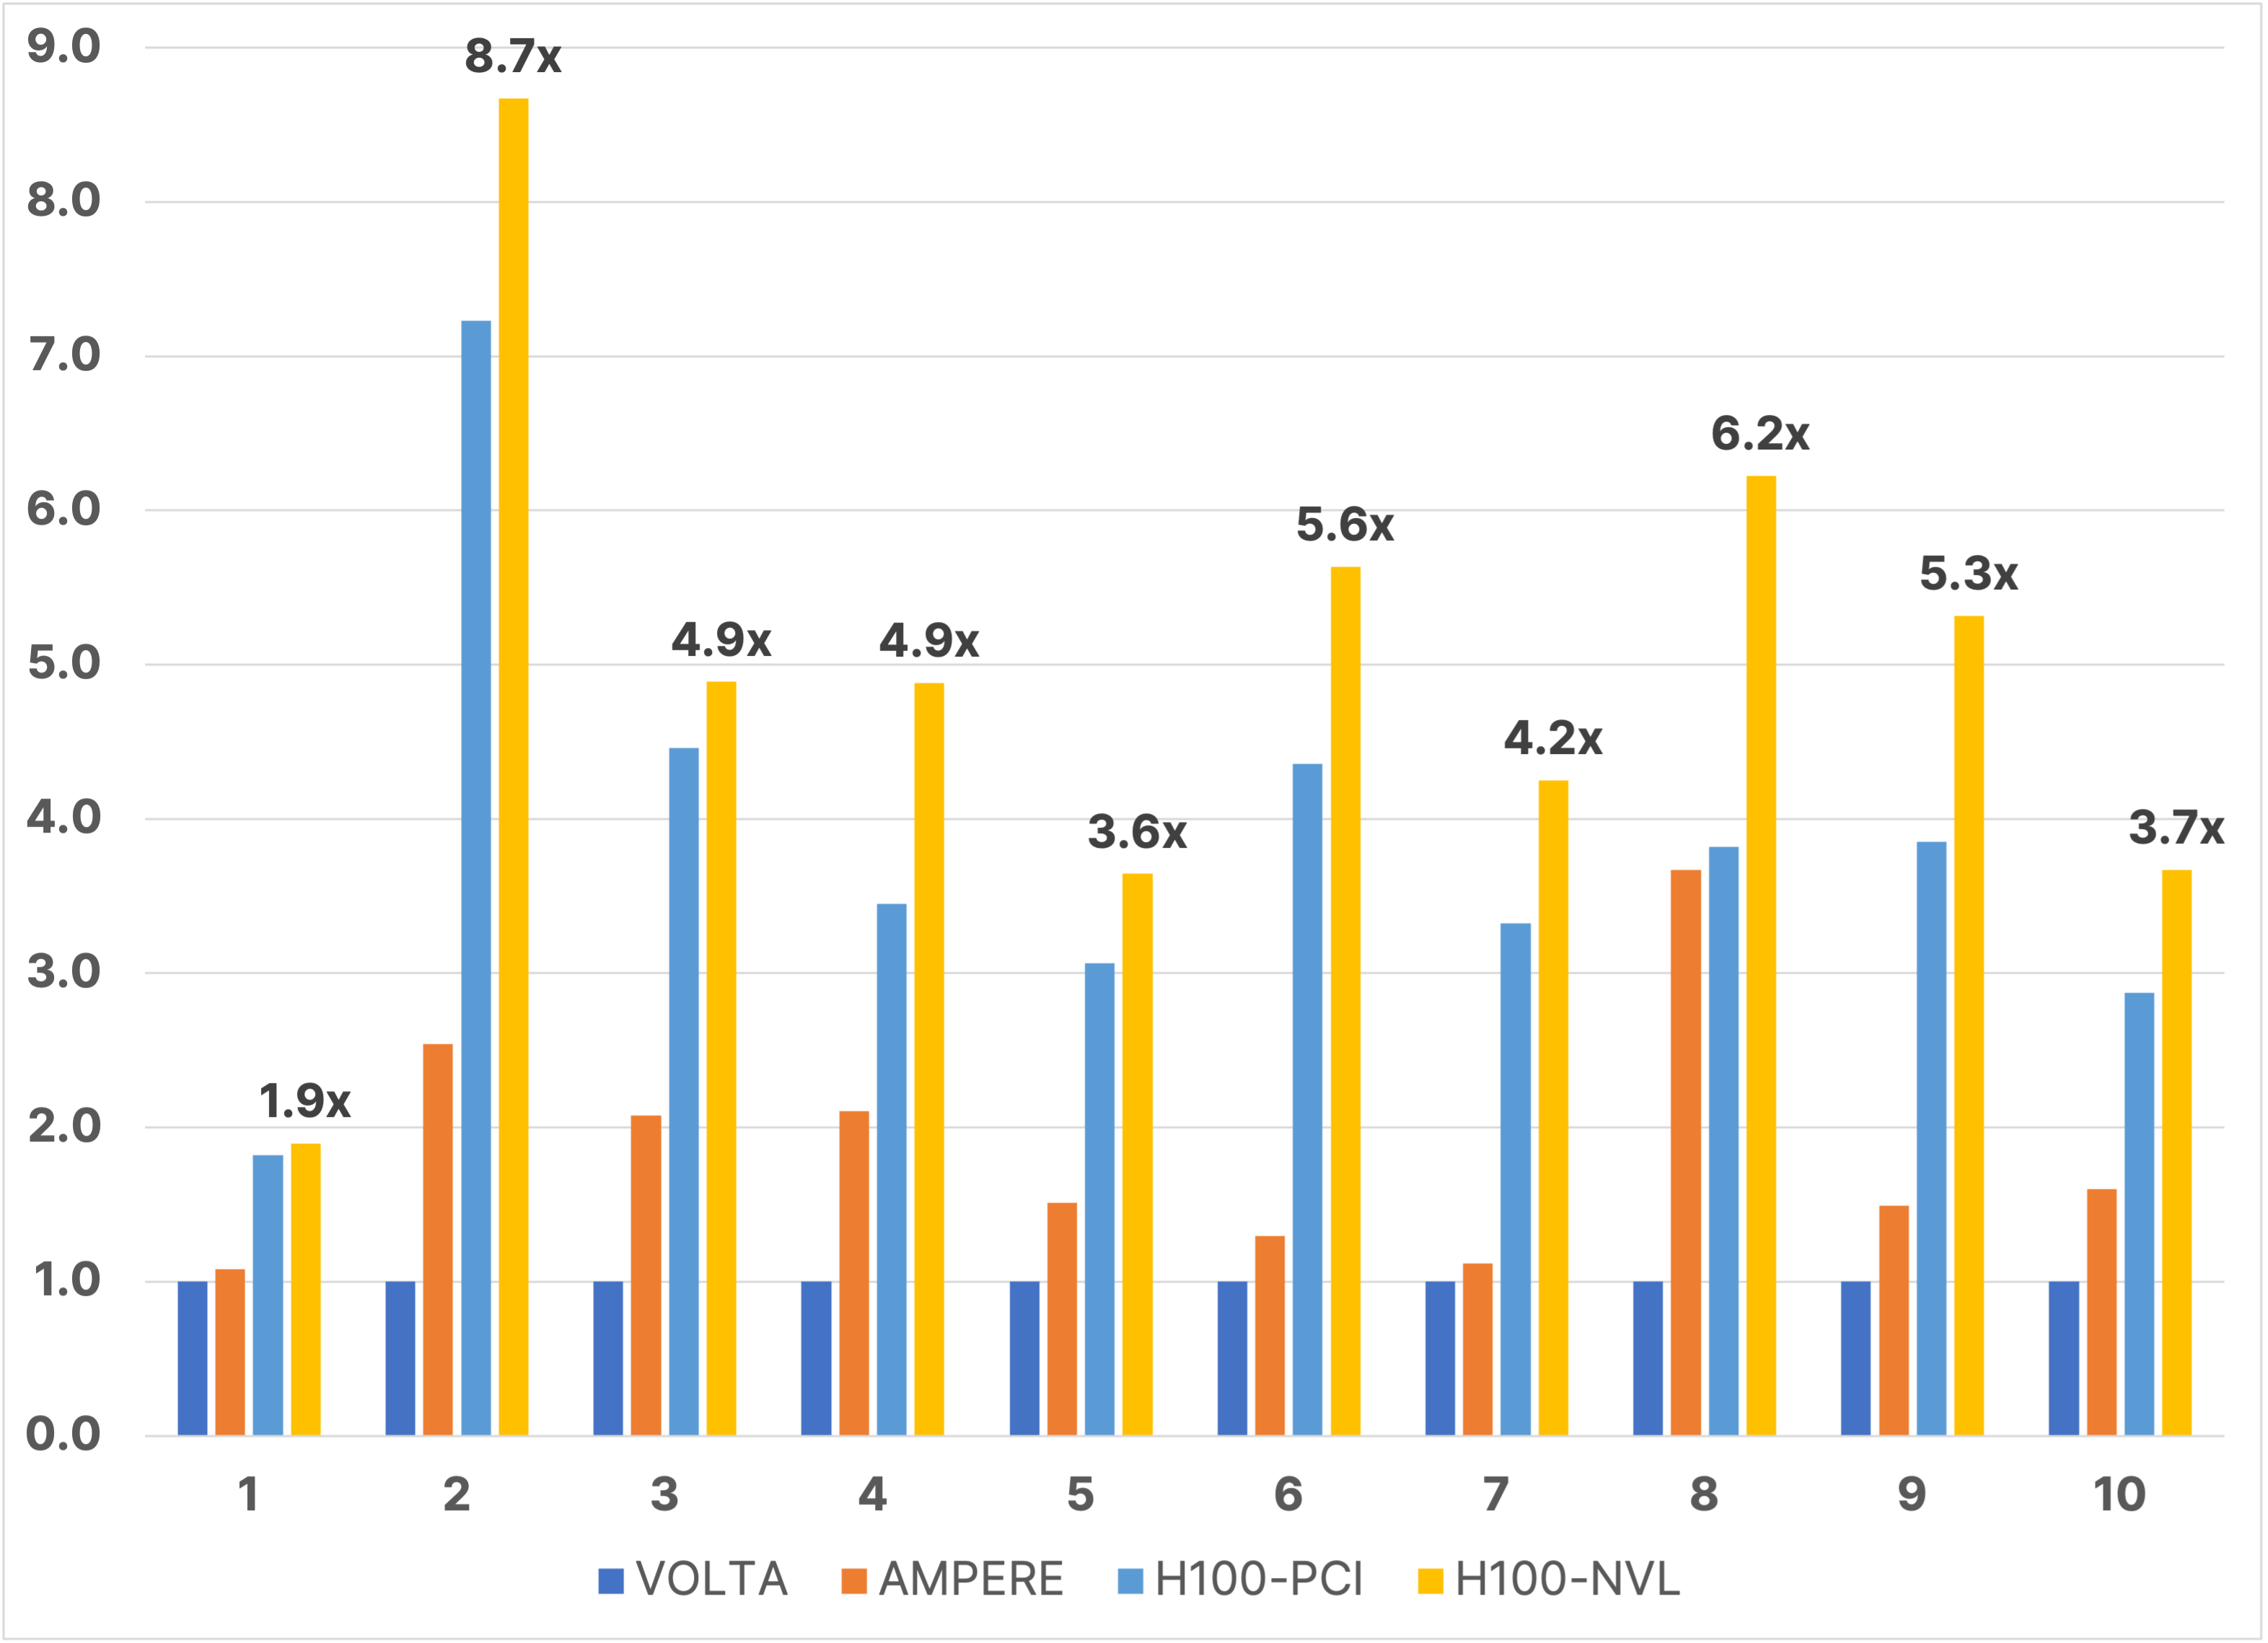
For ten different asset models, the relative performance as measured by total elapsed time of the V100, A100, H100 PCIe, and H100 NVL GPUs and the Grace Hopper Superchip is shown in Figure 1. V100 GPU performance is normalized at 1.0 for each model to allow a meaningful comparison. The models increase in size from left to right from Model 1 (83,000 cells) to Model 10 (6.7 million cells).
Figure 1. The relative performance using total elapsed time of five different NVIDIA platforms for 10 different asset models. Models increase in size from left to right, ranging from Model 1 (83,000 cells) to Model 10 (6.7 million cells). The suite contains both black oil and compositional models.
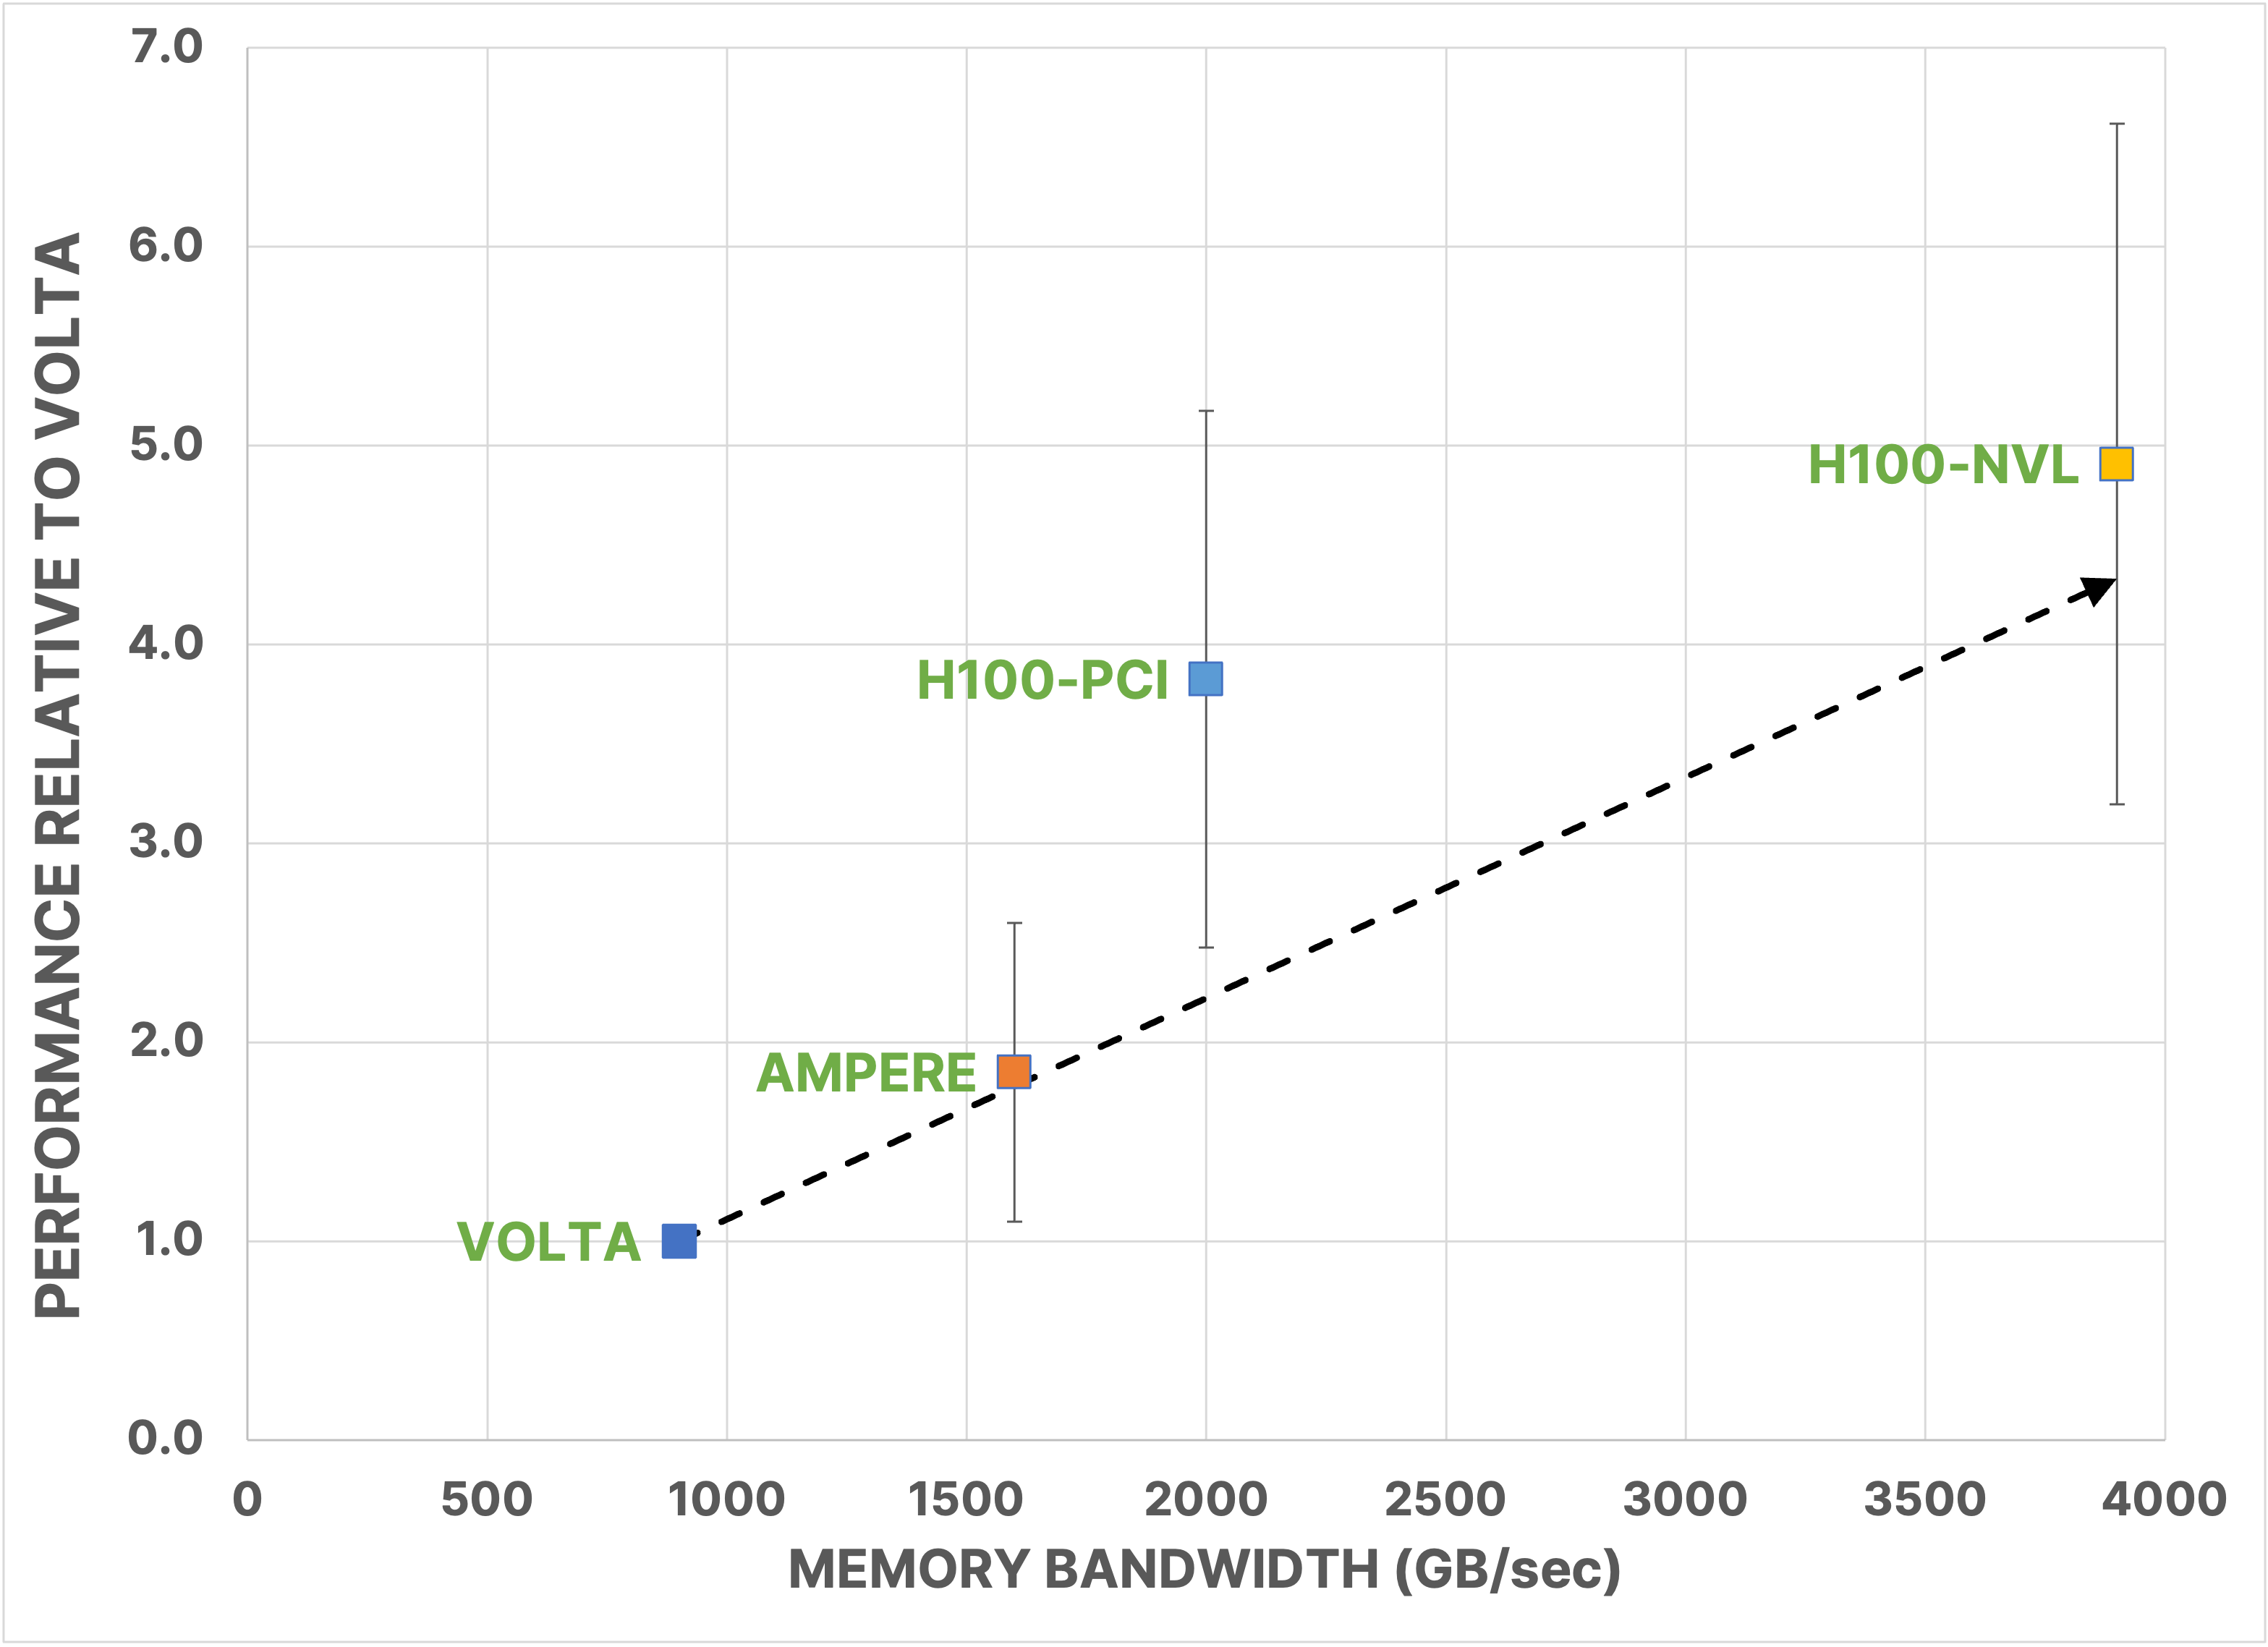
For the ten models considered, the average performance gain on A100 GPUs is 1.75x ± .55, on H100 PCIe GPUs it is 2.32x ± .64, on H100 NVL GPUs it is 2.85x ± .82, and on the Grace Hopper Superchip it is 3.45x ± 1.07. We note that Model 1 is too small, at 83,000 cells, to saturate the GPU and make full use of its resources. For a given model, performance monotonically increases with each generation; however, there is variation in the realized gain. Excluding Model 1, for example, the gain on A100 GPUs ranges from 1.1x on Model 7 to 2.75x on Model 8. Similar variations are seen for the other platforms. There are multiple factors that can contribute to this variation, including the amount of time spent in CPU processes, like I/O, initialization, and some well calculations. Figure 2 presents the linear trend analogous to those we presented in previous years, showing the average speedup of the benchmarking suite vs. the memory bandwidth of the testing platform. We note that while linear performance scaling is still achieved for A100 and H100 PCIe GPUs, H100 NVL GPUs and Grace Hopper Superchips appear to be sub-optimal on this chart. The CPU processes are a culprit, and we can see some evidence for that in that Grace Hopper outperforms H100 NVL GPUs. With identical GPUs, the principal difference between them is the CPU capability. For H100 NVL GPUs and Grace Hopper, the GPU portion of the code is performing so rapidly that whatever remains on CPU may be starting to illustrate Amdahl’s law behavior, reducing performance compared to the perfectly linear forecast. It is also possible that the improved performance on Grace Hopper is due to the increased bandwidth between GPU and CPU, since the Grace Hopper NVLink-C2C bandwidth is 7X faster than x86 plus Hopper systems’ PCIe Gen5 bandwidth.
Figure 2. The average performance gain in total elapsed time of the ten asset model benchmark suite for five different NVIDIA platforms. Performance is measured relative to Volta. Note that the standard deviation for H100-NVL is .82 but not shown on the plot to reduce clutter.
To investigate further, we show results for the linear solver kernel alone, which executes entirely on GPUs. Figure 3 shows the relative performance of the solver kernel for the 10 different assets on V100, A100, H100 PCIe, and H100 NVL GPUs. Results for the solve kernel were not collected for Grace Hopper. We see a marked improvement in the relative performance, indicating that the GPU kernels themselves are making very efficient use of the available bandwidth. Figure 4 shows the relative performance vs. memory bandwidth for the solve kernel more clearly. Here we see that each GPU platform is at or above the ideal linear line.
Figure 3. The relative performance using the GPU solver kernel of five different NVIDIA platforms for 10 different asset models. Models increase in size from left to right, ranging from Model 1 (83,000 cells) to Model 10 (6.7 million cells). The suite contains both black oil and compositional models.
Figure 4. The average performance gain in the solve kernel for the ten asset model benchmark suite for five different NVIDIA platforms. Performance is measured relative to Volta.
CONCLUSIONS
Linear performance scaling of ECHELON with GPU bandwidth continues with the NVIDIA Hopper chip, and that is great news for ECHELON users and any application that is designed to execute on GPU. While Hopper has 2.2x more bandwidth than Volta, we see at least one model executing up to 3.8x faster. Memory capacity has also increased substantially over the last decade, from the first Tesla chips with 4 gigabytes to Hopper with 96 gigabytes. ECHELON uses memory very efficiently, for example, a black oil simulation uses about 3.5 gigabytes per million cells. This allows us to execute black oil models with up to 25 million cells on the Hopper GPU. This is much larger than the average model size that users tend to utilize in most simulation runs. Since simulating a small reservoir model on Hopper leaves the majority of the chip's resources idle, the ability to execute multiple models on the same chip in parallel is a “must-have” rather than a “nice-to-have” feature. Fortunately, NVIDIA’s Multi-Process Service (MPS), available since Volta and supported by ECHELON, allows the efficient sharing of GPU resources between multiple processes. See our paper: Improving GPU Throughput of Reservoir Simulations using NVIDIA MPS and MIG
At present, HPC users in the scientific community need to carefully analyze and weigh the benefits of improved performance against the high costs associated with switching to the new Hopper architecture. While GPU demand by the Crypto community has sharply dropped in the wake of the recent demise of cryptocurrencies, the new AI boom, specifically the popularity of large language models and generative AI, has severely skewed the supply/demand relationship. Consequently, the high ratio of price increases vs performance improvements cautions against hasty decisions. This is further emphasized given that performance increases observed in AI applications using tensor cores tend to be much larger than for general scientific HPC applications. In summary, our message is that ECHELON continues to demonstrate powerful performance improvements from new GPU hardware developments, but clients should make their own price/benefit analysis with respect to their specific performance goals, needs and resources. Ultimately the market will correct, and supply will come into balance, allowing users to look forward to very substantial performance gains in their reservoir engineering workflows.
ACKNOWLEDGEMENTS
We would like to thank NVIDIA for providing early access to a Grace Hopper system and especially Dr. Pavel Dimitrov for facilitating the benchmarking on this system. We would also like to thank Eni for access to asset models for benchmarking.